
GeoRank
GeoRank combines satellite-calibrated climate data with tax, visa, and cost metrics to rank every place on earth for relocation research.
VisitPublished on:
July 14, 2026
Pricing:
About GeoRank
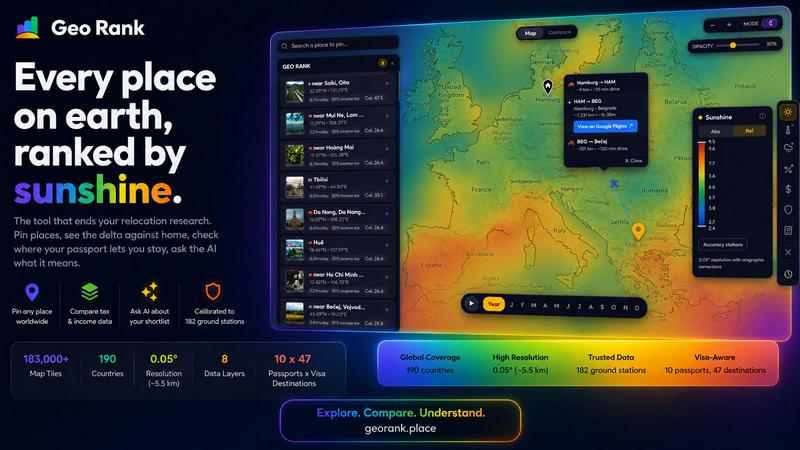
GeoRank is a free, no-signup interactive map tool designed to consolidate the fragmented process of international relocation research. Instead of juggling a dozen open tabs for weather, cost of living, tax rates, visa policies, and safety data, GeoRank layers eight calibrated data sets over a global grid with approximately 5 km resolution. The platform integrates sunshine and temperature data from SARAH-3 satellite observations and ERA5 reanalysis, bias-corrected against 182 ground stations worldwide (including Reykjavik, Phoenix, and Sydney). It also incorporates tax rates sourced from OECD, PwC, and KPMG databases, visa and residency routes for 10 passports across 47 destinations, cost of living data from 478 cities, geopolitical risk assessments, and a community-driven "Nomad Pulse" sentiment layer. Users can pin up to 20 candidate locations, compare them against a home baseline using delta metrics (warmer, cheaper, safer, taxed differently), and interact with an AI assistant that reasons exclusively over the user's own shortlist. GeoRank is built for digital nomads, remote workers, expatriates, and anyone facing the concrete decision of where to live next, not merely for casual data browsing.
Features of GeoRank
Explore Globally with 9 Live Data Layers
GeoRank provides nine toggleable, live data layers that cover the entire globe at a 0.05 degree resolution (approximately 5.5 km per cell). Users can pan across 190 countries and zoom into specific regions while toggling layers for sunshine, temperature, rainfall, outdoor hours, taxes, visas and residency, cost of living, geopolitical risk, and Nomad Pulse sentiment. Each layer is sourced from authoritative datasets, such as SARAH-3 satellite data for sunshine, OECD tax databases, and cost-of-living indices from 478 urban centers. This feature transforms a static map into a dynamic, multi-dimensional decision tool that reveals how different factors interact at any given location.
Pin and Compare Against Your Home Baseline
Users can click any location on the map to pin it, saving up to 20 places across browser sessions. The Compare mode then allows users to set their current home location as a baseline. Every pinned location is measured against this baseline using delta metrics, showing exactly how much warmer, cheaper, safer, or differently taxed each candidate place is relative to the user's current reality. This feature eliminates the need for manual calculations and provides an immediate, intuitive understanding of trade-offs, such as "this city is $700 per month more expensive but offers 1,200 more sunshine hours per year."
AI Assistant Focused on Your Shortlist
GeoRank includes an AI chat feature that operates exclusively on the user's pinned locations, not on a generic knowledge base. Users can ask specific questions like "Which of my 5 places has the best winter?" or "Score my shortlist by sunshine, cost, and low tax combined." The AI reasons across all metrics for every pinned place in one response, providing cited, grounded answers that reference the underlying data sources (e.g., SARAH-3 sunshine data, OECD tax rates). This transforms raw data into actionable, personalized insights without requiring users to manually cross-reference multiple tables.
Community-Driven Nomad Pulse Sentiment
The Nomad Pulse layer tracks weekly sentiment from the digital nomad community by processing social posts into rising, stable, or falling signals per country and city. Unlike static official datasets, this feature captures real-time enthusiasm and emerging trends before they become mainstream. Users can see where community interest is building, providing a qualitative complement to quantitative data like tax rates or sunshine hours. This layer is particularly valuable for identifying up-and-coming destinations that may not yet appear in traditional relocation guides.
Use Cases of GeoRank
Digital Nomad Selecting a Winter Base
A digital nomad with a UK passport wants to spend three months in a warm, low-tax location with reliable internet. Using GeoRank, the user pins five candidate cities, sets their current home (London) as the baseline, and toggles the sunshine, tax, and visa layers. The Compare mode immediately shows that Paphos offers 3,140 sunshine hours per year versus London's 1,600, with a 0% non-dom tax rate and a 90/180 day visa-free stay. The AI assistant confirms that Paphos meets the 2,800 sunshine threshold, while Tbilisi falls short at 1,987 hours, enabling a confident, data-backed decision.
Remote Worker Evaluating Cost of Living vs. Safety
A remote worker considering a move from San Francisco to either Medellin or Lisbon uses GeoRank to compare cost of living and geopolitical risk side by side. The cost of living layer, sourced from 478 cities, shows Medellin at approximately $1,200 per month versus Lisbon at $2,000, while the geopolitical risk layer flags Medellin as moderate and Lisbon as low. The AI assistant can then answer, "Which city offers the best balance of low cost and low risk?" providing a weighted analysis based on the user's pinned shortlist.
Family Relocation with Multiple Criteria
A family with children is considering moving from Berlin to either Valencia or a smaller town in Portugal. They use GeoRank to evaluate sunshine hours (important for seasonal affective disorder), outdoor hours for children's play, tax rates for a dual-income household, and visa residency routes for their passports. The Compare mode shows deltas for each metric, and the AI assistant can answer complex questions like "What are the tradeoffs between Valencia and Cascais for a family with school-age children?" The assistant integrates all data layers to highlight that Valencia offers more sunshine and lower cost but Portugal provides a clearer residency path.
Investor Comparing Tax Regimes Across Jurisdictions
An investor with multiple passports wants to minimize capital gains tax on cryptocurrency holdings. Using GeoRank, they toggle the tax layer and filter by crypto CGT rates, which are sourced from OECD, PwC, and KPMG databases. They pin several jurisdictions, set their current home as the baseline, and the Compare mode shows exact tax deltas. The AI assistant can then answer, "Which of my pinned places has the lowest effective tax rate for my specific income structure?" providing a customized comparison that considers both tax rates and visa eligibility.
Frequently Asked Questions
What data sources does GeoRank use and how are they calibrated?
GeoRank integrates eight primary data layers sourced from authoritative scientific and economic databases. Sunshine and temperature data come from SARAH-3 satellite observations and ERA5 reanalysis, which are bias-corrected against 182 ground stations worldwide, including stations in Reykjavik, Phoenix, and Sydney. Tax rates are sourced from OECD, PwC, and KPMG databases. Cost of living data is aggregated from 478 cities. Visa and residency routes cover 10 passports across 47 destinations. All data is processed at a 0.05 degree resolution (approximately 5.5 km per grid cell) and updated on a monthly climatology basis for weather layers.
Is GeoRank free to use and do I need to create an account?
GeoRank is completely free to use and requires no signup or account creation. Users can access all nine data layers, pin up to 20 locations, use the Compare mode with home baseline deltas, and interact with the AI assistant without providing any personal information. Pinned locations are saved across browser sessions using local storage, so returning users will find their shortlist intact without needing to log in.
How does the AI assistant work and what can it answer?
The AI assistant operates exclusively on the user's pinned locations and their associated data metrics. It cannot access external information or generic knowledge bases. Users can ask questions like "Which of my pinned places is best for a winter base?" or "Score my shortlist by sunshine, cost, and low tax combined." The assistant provides cited, grounded answers that reference specific data sources (e.g., SARAH-3 sunshine data, OECD tax rates) and reasons across all metrics for every pinned place in a single response. This ensures answers are personalized, accurate, and directly applicable to the user's decision.
How accurate are the weather and climate data layers?
Weather data layers are calibrated against 182 ground stations, providing ±8% accuracy for most locations. However, accuracy varies by geography: high-altitude locations may have ±15% error margins, and coastal microclimates may see ±20% deviations. The data is based on monthly climatology averages, so it represents typical conditions rather than real-time weather. Users should treat these as general guidance for comparing locations rather than precise forecasts. The Nomad Pulse layer provides complementary, real-time community sentiment that can help identify emerging trends not captured by climatological averages.
Pricing of GeoRank
GeoRank is currently completely free to use with no signup required. There are no paid tiers, subscription plans, or premium features. All nine data layers, the pin and compare functionality, and the AI assistant are accessible to all users without any cost. The platform is supported independently and does not require user accounts or payment information.
Similar to GeoRank

Privacy-first, cookieless web analytics that ties your traffic and marketing channels to real Stripe revenue.

Free YouTube transcripts on the web, a Chrome extension, and an API + MCP server so AI assistants can read YouTube.

Moderation, routing, intent and scoring for any text over one Jev-compatible API, hosted in the EU.

MiroFish is an AI simulation chat for scenario prediction. Ask a question in plain language and it runs graph building, multi-agent simulation, and re

Online tally counter for tracking attendance, workouts, inventory, visitors, sports scores, habits, and everyday counting tasks.


