Fusedash vs StatPecker
Side-by-side comparison to help you choose the right product.
Fusedash is an AI-powered platform that transforms raw data into actionable dashboards and charts for instant team.
Last updated: March 4, 2026

StatPecker
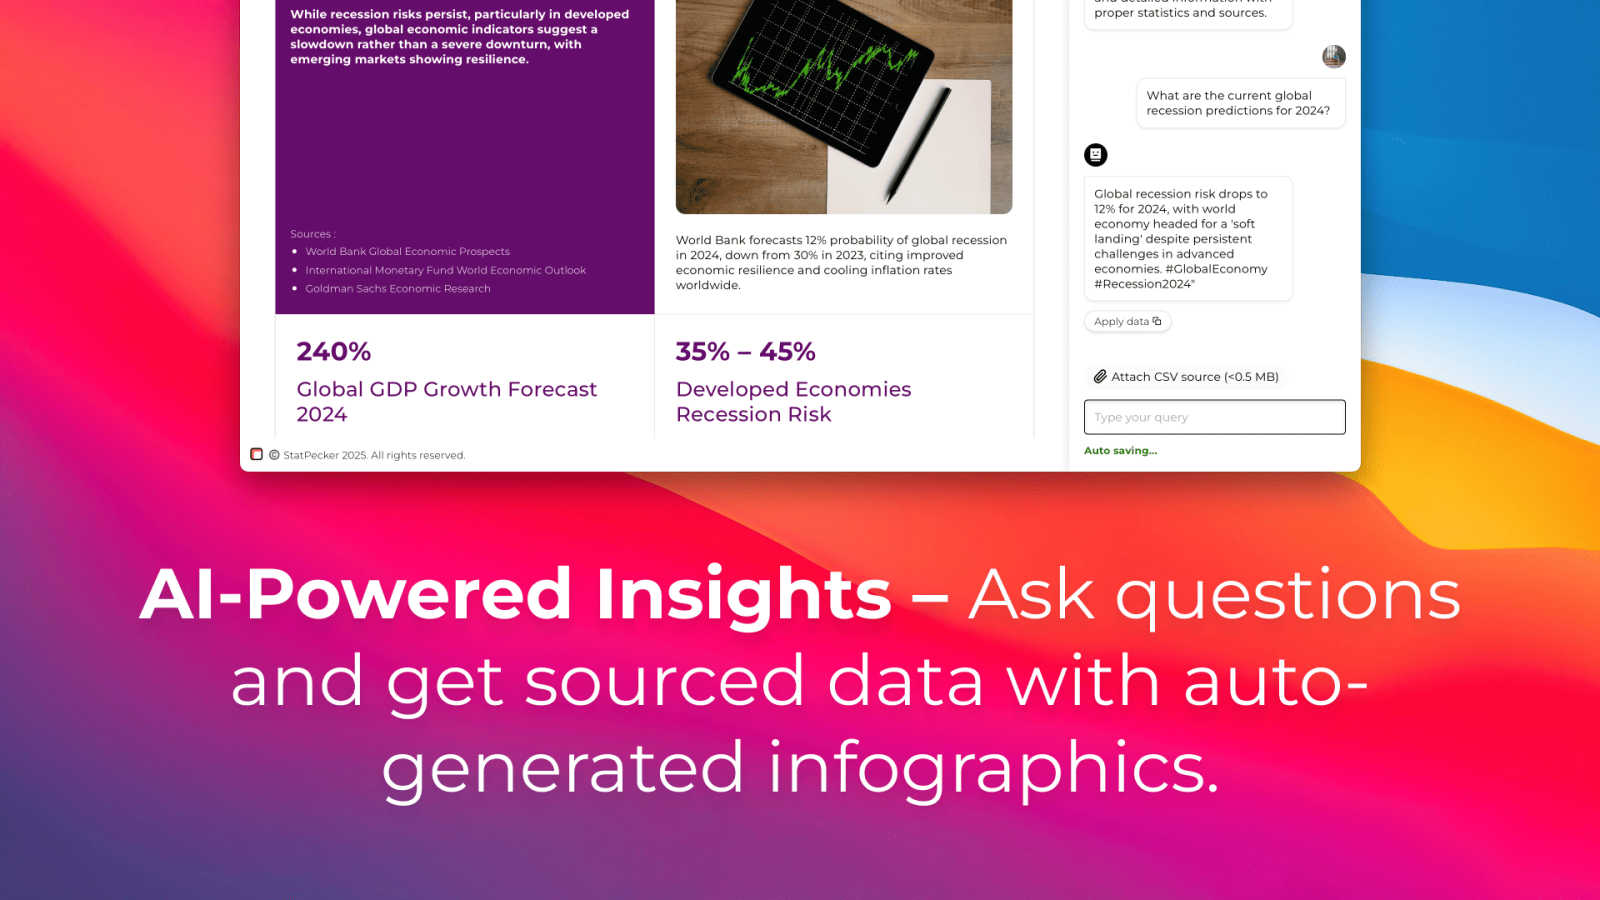
StatPecker delivers fast, secure AI-driven insights from your data, transforming them into stunning visuals for sharing.
Last updated: March 1, 2026
Visual Comparison
Fusedash

StatPecker
Feature Comparison
Fusedash
Unified AI-Powered Workspace
Fusedash consolidates the entire data visualization workflow into a single platform, eliminating the need to juggle multiple tools. Users can create decision-ready dashboards, interactive charts, detailed geospatial maps, and narrative reports all from the same connected dataset. This integrated approach, which combines visualization, storytelling, and real-time monitoring, significantly reduces the time spent on rebuilding and reconciling reports across different systems, allowing teams to focus on deriving and acting on insights.
AI Chart Generator
This feature accelerates the initial stages of data analysis by enabling users to generate clear, appropriate charts from CSV files or connected APIs in minutes. The AI assists in selecting the optimal chart type, applying relevant comparisons, and refining labels to ensure the visual accurately tells the data's story. These AI-generated charts can be used as standalone visuals for quick reports or seamlessly dropped into comprehensive dashboards, promoting reusability and consistency.
Consistent Metric Definitions & Governance
A foundational feature of Fusedash is the ability to define core metrics, dimensions, and KPIs in a centralized manner. Once established, these definitions are automatically applied and reused across every view, dashboard, and report built on the platform. This enforced consistency is critical for data integrity, ensuring all stakeholders across departments are analyzing and making decisions based on the same trusted numbers, thereby eliminating conflicting data stories.
Smart AI Chat for Data Exploration
Fusedash incorporates a natural language interface that allows users to interact with their data conversationally. Users can ask questions in plain language, request specific breakdowns by segment or region, and receive AI-suggested metrics and chart types. This feature lowers the barrier to entry for data exploration and can instantly turn conversational insights into shareable, persistent dashboard views, streamlining the path from question to actionable visual.
StatPecker
Ask Your Query
This feature allows users to obtain instant insights from validated sources using AI. By simply asking questions, users can bypass complex tools and receive accurate data visualizations tailored to their inquiries, streamlining the data analysis process.
Publish & Embed
StatPecker enables users to create interactive visuals that can be seamlessly integrated into blogs, articles, and websites. This feature enhances the reach and engagement of data presentations, making it easy to share compelling infographics with a wider audience.
Upload & Analyze CSVs
Users can upload local CSV files (up to 50MB) and extract key insights without the hassle of traditional spreadsheet tools. This functionality ensures that data analysis remains private and efficient, allowing users to explore their data with straightforward queries.
Download & Use Anywhere
StatPecker allows users to export their infographics as images, making them suitable for reports, presentations, and more. This feature ensures that users can utilize their visuals across various platforms without technical constraints.
Use Cases
Fusedash
Executive & Leadership Reporting
Leadership teams require a high-level, consistent view of organizational health. Fusedash enables the creation of executive dashboards that combine real-time KPI monitoring with narrative "storytelling" sections. This provides context on what changed, why it matters, and what the next steps are, ensuring all leaders are aligned on performance and strategy without sifting through conflicting reports from different departments.
Marketing Performance Analysis
Marketing teams can use Fusedash to unify data from various channels (social media APIs, ad platforms, CRM systems) into a single dashboard. They can track campaign KPIs, use the AI chart generator for rapid analysis of A/B test results, and employ geospatial maps to visualize regional performance. The consistent definitions ensure that metrics like CAC (Customer Acquisition Cost) or ROAS (Return on Ad Spend) are calculated uniformly across all reports.
Operational & Real-Time Monitoring
Operations and support teams need live visibility into key processes. Fusedash's real-time interface allows for the creation of monitoring dashboards that track live metrics, such as website uptime, customer support ticket volume, or production line output. Teams can set alerts and drill down into specific time periods or segments to diagnose issues as they occur, moving from passive observation to proactive management.
Cross-Departmental Data Democratization
Organizations seeking to foster a data-driven culture can deploy Fusedash as a shared platform. Different teams—sales, finance, product—can build their own tailored views (dashboards, charts, reports) from the same governed dataset. The AI chat feature empowers non-analyst employees to ask their own data questions, reducing the bottleneck on data specialists and enabling faster, more widespread insight discovery.
StatPecker
Content Creation for Blogs
Content creators can utilize StatPecker to generate visually appealing infographics that enhance their blog posts. The platform’s automated capabilities streamline the creation process, saving time and effort while ensuring high-quality visuals that engage readers.
Data Reporting for Businesses
Business professionals can leverage StatPecker to create insightful reports that communicate key metrics and trends. The ability to quickly generate visuals from data empowers teams to make informed decisions based on clear, visually represented information.
Educational Presentations
Educators and students can use StatPecker to produce informative infographics for presentations and projects. The platform's user-friendly interface allows users to focus on storytelling rather than on complex design processes, facilitating effective communication of ideas.
Journalism and Media
Journalists can benefit from StatPecker by quickly creating compelling visuals that enhance their articles and reports. The platform enables the transformation of complex data into easily digestible formats, making stories more impactful and engaging for readers.
Overview
About Fusedash
Fusedash is an AI-powered data visualization and business intelligence platform engineered to eliminate data silos and reporting inconsistencies within modern organizations. It functions as a unified workspace where teams can transform raw, connected data from disparate sources into clear, interactive, and actionable insights. The platform is specifically designed for teams burdened by manual reporting cycles, conflicting data narratives, and the inefficiency of rebuilding the same analytical logic across multiple, disconnected tools like spreadsheets, standalone BI software, and presentation decks. Its core value proposition, as supported by industry research on data-driven decision-making, is the establishment of a single source of truth. By allowing users to define key metrics and KPIs once, Fusedash ensures these consistent definitions are reused across every dashboard, chart, map, and narrative report. This governance model not only accelerates report creation but also guarantees alignment across the organization—from executive leadership to marketing and operations teams. Furthermore, Fusedash integrates advanced AI capabilities, including natural language data chat and smart visualization assistance, to democratize data exploration and make sophisticated analysis accessible to non-technical users. Ultimately, it empowers organizations to move beyond passive monitoring to active understanding, enabling users to drill down into the "why" behind performance shifts and drive unified action based on trusted data.
About StatPecker
StatPecker is an innovative AI-powered data visualization platform that aims to simplify the process of creating professional-grade infographics. Designed to address the common challenges associated with data communication, StatPecker significantly reduces the time, cost, and technical expertise typically required to convert raw data into visually compelling narratives. By automating the data storytelling process, it allows users—including content creators, journalists, data analysts, marketers, business professionals, educators, and students—to generate engaging infographics in mere seconds. The platform not only enhances the clarity and credibility of data-driven communication but also reduces production overhead. As highlighted on its official site, StatPecker provides "quick, credible answers you can publish, present, or share with your team," making it an indispensable tool for anyone looking to make data more understandable and persuasive.
Frequently Asked Questions
Fusedash FAQ
What types of data sources can I connect to Fusedash?
Fusedash offers flexible data integration capabilities. You can start by uploading static CSV files for one-time analysis or connect directly to live data sources via API integrations. The platform is designed to combine multiple datasets—including enriching your views with public data for geographic or market context—into a single, coherent workspace for analysis and reporting.
How does Fusedash ensure data consistency across my organization?
Fusedash employs a centralized metric definition system. When you define a key performance indicator (KPI), such as "Monthly Recurring Revenue," you establish its calculation formula, data source, and filters once. This definition is then locked and reused automatically in every dashboard, chart, and report that references that KPI, ensuring absolute consistency and eliminating version control issues common in spreadsheet-based reporting.
Is the AI Chat feature suitable for users without technical or SQL knowledge?
Absolutely. The Smart AI Chat feature is specifically designed to democratize data access. Users can ask questions using natural, plain language (e.g., "What were sales in the Northwest region last quarter?" or "Show me a trend of website traffic by source"). The AI interprets the query, fetches the relevant data, and can suggest appropriate visualizations, making advanced data exploration accessible to business users without coding skills.
Can I share the dashboards and reports created in Fusedash with external stakeholders?
Yes, Fusedash includes robust sharing and collaboration functionalities. You can share interactive dashboards or snapshot reports with both internal team members and external stakeholders, such as clients or investors. Access can be controlled, and views can be customized with specific filters to ensure each audience sees the most relevant information without exposing underlying sensitive data.
StatPecker FAQ
What types of users can benefit from StatPecker?
StatPecker is designed for a diverse range of users, including content creators, journalists, data analysts, marketers, business professionals, educators, and students, all of whom can leverage the platform's capabilities to enhance data communication.
How does the Local SQL Agent feature work?
The Local SQL Agent feature allows users to upload local CSV files and perform on-device analysis without compromising data privacy. Users can ask questions about their data, and the platform generates visuals based on these queries, ensuring a seamless workflow.
Can I integrate StatPecker visuals into my existing website?
Yes, StatPecker allows users to publish and embed created visuals directly into blogs, articles, and websites, making it easy to share engaging infographics with a broader audience.
What is the pricing structure of StatPecker?
StatPecker offers a free tier with unlimited projects and embeds, alongside a paid lifetime access plan that includes all features, unlimited AI queries, and CSV uploads. Users can choose the plan that best fits their needs and budget.
Alternatives
Fusedash Alternatives
Fusedash is an AI-powered business intelligence and data visualization platform. It is designed to help teams consolidate data from various sources into a unified workspace, creating consistent dashboards, charts, and reports that serve as a single source of truth for organizational decision-making. Users may explore alternatives to Fusedash for several common reasons. These include budget constraints and specific pricing model needs, the requirement for specialized features or deeper integrations with an existing tech stack, and differing preferences for user interface complexity or scalability for larger enterprise deployments. The search often stems from a need to find the optimal balance of power, accessibility, and cost for a team's unique data maturity and workflow. When evaluating alternatives, key considerations should include the platform's core data modeling capabilities, ensuring metric definitions remain consistent across reports. Assess the ease of use for both analysts building views and business users consuming insights, and verify robust data security and governance features. Finally, consider the total cost of ownership, including implementation effort and the platform's ability to scale with your data volume and team growth.
StatPecker Alternatives
StatPecker is an AI-powered data visualization platform that simplifies the process of transforming raw data into compelling infographics. By automating data storytelling, it caters to a diverse audience, including content creators, marketers, and educators, enabling them to produce professional-grade visuals quickly and efficiently. Users often seek alternatives to StatPecker due to various reasons, such as pricing structures, specific features, or compatibility with their existing platforms. When selecting an alternative, it is important to consider factors such as user-friendliness, the range of visualization options available, integration capabilities, and the overall cost-effectiveness of the tool to ensure it meets your unique data needs and organizational goals.