Customer Feedback vs StatPecker
Side-by-side comparison to help you choose the right product.
Customer Feedback
Gather customer insights effortlessly and engage your community with actionable feedback.

StatPecker
StatPecker delivers fast, secure AI-driven insights from your data, transforming them into stunning visuals for sharing.
Last updated: March 1, 2026
Visual Comparison
Customer Feedback

StatPecker
Feature Comparison
Customer Feedback
Collect Feedback Everywhere
Customer Feedback allows businesses to gather insights from multiple touchpoints, including website widgets, online forms, and wishlist features. This ensures that feedback is obtained from various customer interactions, providing a holistic view of user sentiment.
AI-Powered Pattern Recognition
With advanced AI capabilities, Customer Feedback analyzes raw comments to uncover patterns and trends. This feature eliminates the need for manual sorting, enabling teams to focus on high-impact areas for improvement based on data-driven insights.
Easy Update Sharing
Keeping users informed about changes and updates is crucial for maintaining engagement. Customer Feedback simplifies this process by allowing businesses to share updates effortlessly, ensuring that users stay connected and excited about new features or improvements.
Customizable Feedback Widgets
The tool offers customizable feedback widgets that can be tailored to fit the branding and specific needs of a business. This flexibility ensures that companies can maintain their identity while effectively collecting user insights.
StatPecker
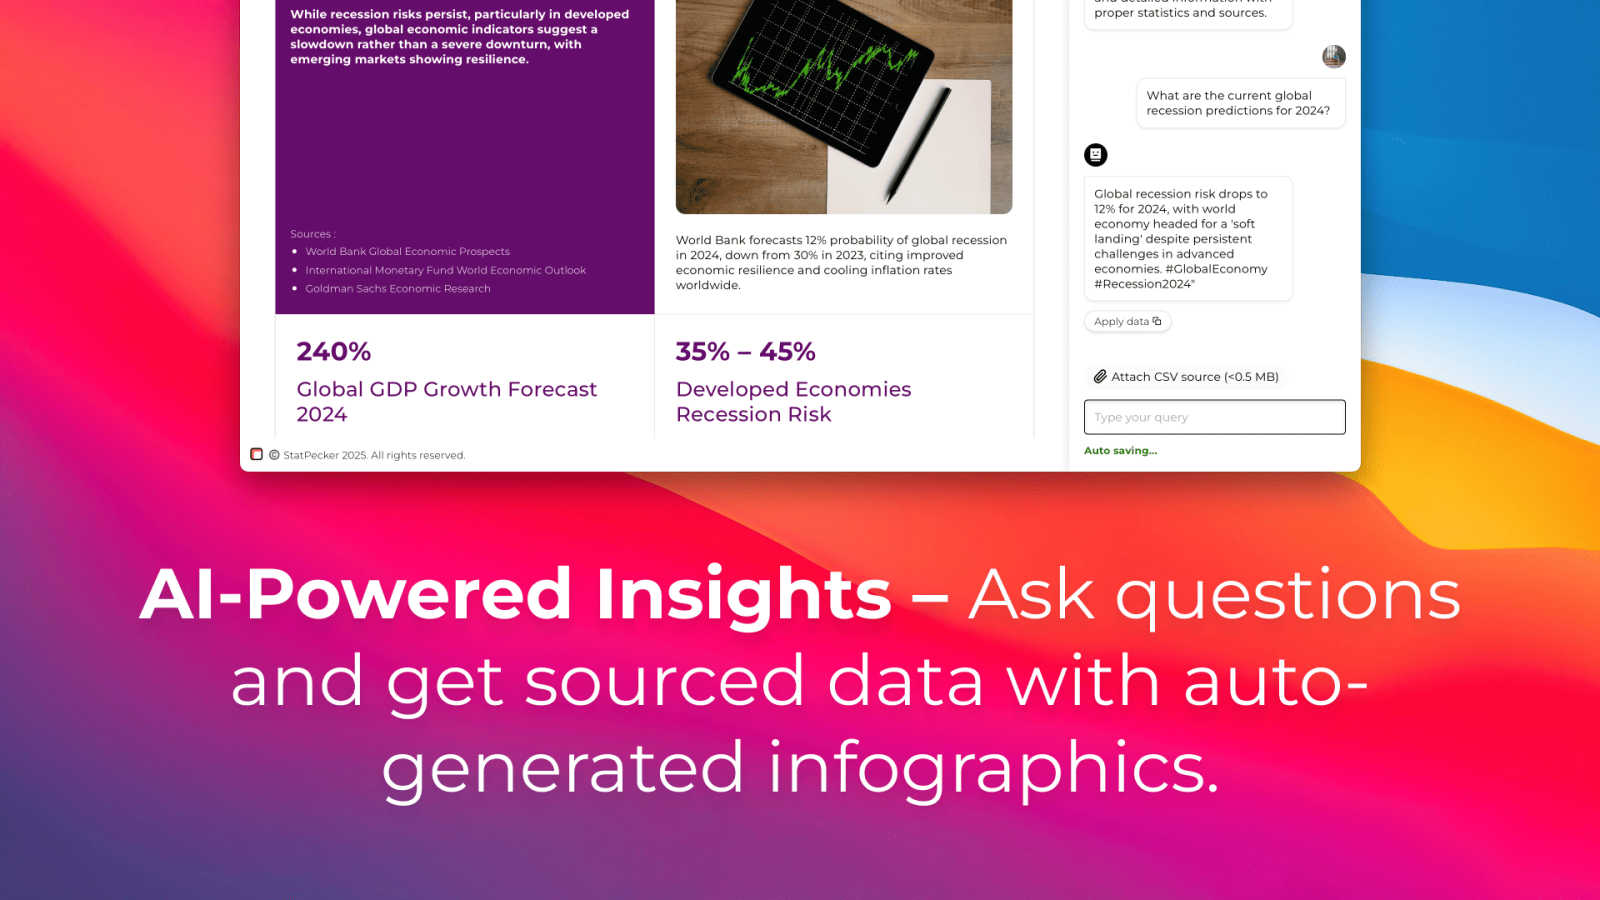
Ask Your Query
This feature allows users to obtain instant insights from validated sources using AI. By simply asking questions, users can bypass complex tools and receive accurate data visualizations tailored to their inquiries, streamlining the data analysis process.
Publish & Embed
StatPecker enables users to create interactive visuals that can be seamlessly integrated into blogs, articles, and websites. This feature enhances the reach and engagement of data presentations, making it easy to share compelling infographics with a wider audience.
Upload & Analyze CSVs
Users can upload local CSV files (up to 50MB) and extract key insights without the hassle of traditional spreadsheet tools. This functionality ensures that data analysis remains private and efficient, allowing users to explore their data with straightforward queries.
Download & Use Anywhere
StatPecker allows users to export their infographics as images, making them suitable for reports, presentations, and more. This feature ensures that users can utilize their visuals across various platforms without technical constraints.
Use Cases
Customer Feedback
Enhancing Product Development
Product teams can utilize Customer Feedback to gather insights during the development cycle, ensuring that user needs are met. By collecting feedback throughout the process, businesses can make informed decisions that align with user expectations.
Improving Customer Support
Customer Feedback can be integrated into customer support channels to gather insights on user experiences. This information helps support teams identify areas for improvement and enhance overall service quality, leading to increased customer satisfaction.
Monitoring User Engagement
Marketers can leverage Customer Feedback to track user engagement and sentiment regarding campaigns or features. By understanding how users interact with their offerings, marketers can adjust strategies to boost engagement and conversion rates.
Gathering Feature Requests
The wishlist feature of Customer Feedback allows users to submit and vote on desired features. This enables businesses to prioritize development based on actual user demand, ensuring that resources are focused on the most valuable enhancements.
StatPecker
Content Creation for Blogs
Content creators can utilize StatPecker to generate visually appealing infographics that enhance their blog posts. The platform’s automated capabilities streamline the creation process, saving time and effort while ensuring high-quality visuals that engage readers.
Data Reporting for Businesses
Business professionals can leverage StatPecker to create insightful reports that communicate key metrics and trends. The ability to quickly generate visuals from data empowers teams to make informed decisions based on clear, visually represented information.
Educational Presentations
Educators and students can use StatPecker to produce informative infographics for presentations and projects. The platform's user-friendly interface allows users to focus on storytelling rather than on complex design processes, facilitating effective communication of ideas.
Journalism and Media
Journalists can benefit from StatPecker by quickly creating compelling visuals that enhance their articles and reports. The platform enables the transformation of complex data into easily digestible formats, making stories more impactful and engaging for readers.
Overview
About Customer Feedback
Customer Feedback is an all-in-one tool designed to streamline the process of gathering, analyzing, and acting on user feedback. Tailored for businesses of all sizes, this tool empowers companies to collect feedback from various channels, including widgets, forms, and wishlists, making it versatile and comprehensive. Its primary value proposition lies in its ability to leverage artificial intelligence to identify patterns and trends in user comments rapidly. By transforming raw feedback into actionable insights, businesses can enhance their products and services effectively. Additionally, Customer Feedback facilitates easy updates and communications with users, ensuring they remain engaged and excited about product developments. This tool is particularly beneficial for product managers, marketers, and customer success teams, as it fosters a culture of continuous improvement based on genuine user input.
About StatPecker
StatPecker is an innovative AI-powered data visualization platform that aims to simplify the process of creating professional-grade infographics. Designed to address the common challenges associated with data communication, StatPecker significantly reduces the time, cost, and technical expertise typically required to convert raw data into visually compelling narratives. By automating the data storytelling process, it allows users—including content creators, journalists, data analysts, marketers, business professionals, educators, and students—to generate engaging infographics in mere seconds. The platform not only enhances the clarity and credibility of data-driven communication but also reduces production overhead. As highlighted on its official site, StatPecker provides "quick, credible answers you can publish, present, or share with your team," making it an indispensable tool for anyone looking to make data more understandable and persuasive.
Frequently Asked Questions
Customer Feedback FAQ
How does Customer Feedback collect user insights?
Customer Feedback collects user insights through various methods, including customizable widgets, online forms, and wishlist submissions, allowing businesses to gather feedback from multiple touchpoints.
Can I analyze feedback without manual effort?
Yes, Customer Feedback employs advanced AI technology to analyze raw comments and identify patterns. This automation reduces the manual effort required to sort through feedback and allows teams to focus on actionable insights.
How can I keep users informed about updates?
Customer Feedback makes it easy to share updates with users through automated notifications and communication tools within the platform. This keeps users engaged and informed about product changes.
Is Customer Feedback suitable for all business sizes?
Absolutely. Customer Feedback is designed to be scalable and can accommodate businesses of all sizes, from startups to large enterprises, making it a versatile solution for various industries.
StatPecker FAQ
What types of users can benefit from StatPecker?
StatPecker is designed for a diverse range of users, including content creators, journalists, data analysts, marketers, business professionals, educators, and students, all of whom can leverage the platform's capabilities to enhance data communication.
How does the Local SQL Agent feature work?
The Local SQL Agent feature allows users to upload local CSV files and perform on-device analysis without compromising data privacy. Users can ask questions about their data, and the platform generates visuals based on these queries, ensuring a seamless workflow.
Can I integrate StatPecker visuals into my existing website?
Yes, StatPecker allows users to publish and embed created visuals directly into blogs, articles, and websites, making it easy to share engaging infographics with a broader audience.
What is the pricing structure of StatPecker?
StatPecker offers a free tier with unlimited projects and embeds, alongside a paid lifetime access plan that includes all features, unlimited AI queries, and CSV uploads. Users can choose the plan that best fits their needs and budget.