Master Metrics
Master Metrics provides AI-powered dashboards and alerts to unify marketing data for smarter, data-driven decisions.
Visit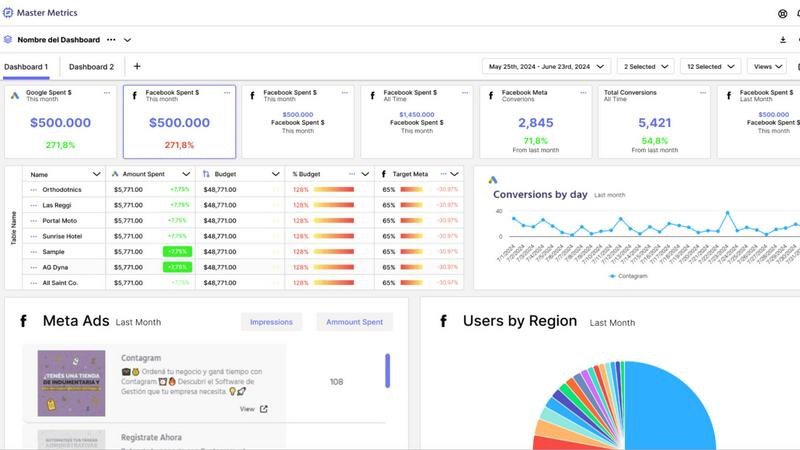
About Master Metrics
Master Metrics is a sophisticated, agency-focused analytics and reporting platform engineered to solve the core data challenges faced by modern marketing teams. Built by digital marketing veterans with firsthand agency experience, the platform is designed to consolidate, analyze, and visualize data from a vast array of sources, transforming fragmented metrics into actionable business intelligence. Its primary value proposition lies in dramatically enhancing productivity and decision-making speed by automating the most time-consuming aspects of data management: collection, unification, and report generation. By aggregating data from various ad networks, social platforms, and CRM systems into a centralized Overview Table, Master Metrics provides an immediate, holistic view of campaign and business performance. This empowers agencies and in-house marketing teams to move from reactive data gathering to proactive strategy, maximizing marketing ROI and sales outcomes. The platform's emphasis on seamless integration with ubiquitous tools like Google Sheets, Google Slides, and Looker Studio ensures it fits effortlessly into existing workflows, making advanced analytics accessible without a steep technical learning curve.
Features of Master Metrics
Unified Overview Control Panel
The Overview Control Panel acts as a mission-critical command center, allowing users to manage all client or campaign accounts from a single interface. Its customizable Overview Table enables teams to see key performance indicators (KPIs) across all data sources at a glance, identifying trends, outliers, and areas requiring immediate attention. Users can merge data using custom formulas and even add proprietary data directly into the table, creating a truly bespoke and comprehensive business intelligence snapshot that drives efficient daily operations and strategic reviews.
AI-Powered Reporting & Google Slides Generation
This feature revolutionizes client reporting by automating the creation of professional, editable Google Slides presentations. Users simply select their data sources, key metrics, goals, and a preferred design template. Master Metrics' AI then synthesizes the data and generates a complete presentation in just a few clicks. This not only saves countless hours of manual report building but also ensures consistency, accuracy, and a polished, data-driven narrative for client communications, directly translating complex analytics into understandable insights.
Proactive Custom Alerts & Budget Control
Master Metrics moves beyond passive dashboards with a powerful alert system that monitors business health in real-time. Users can set conditional alerts for any metric, such as campaign underperformance, declining sales, or CRM close rate drops. Crucially, the platform offers sophisticated budget pacing alerts, notifying teams when daily spend deviates from the trajectory needed to hit monthly targets. These alerts can be delivered via email, WhatsApp, or Slack, enabling proactive campaign management and preventing budget overruns or missed opportunities before they impact results.
Seamless Data Integration & Live Connectors
The platform eliminates manual data exports and spreadsheet headaches by offering live, automated connectors to popular data destinations. Users can seamlessly extract, transform, and merge data from all connected marketing sources directly into Google Sheets or Looker Studio (formerly Google Data Studio). This ensures reports and dashboards always reflect the most current data without manual intervention, fostering trust in data accuracy and freeing up analyst time for higher-value tasks like interpretation and strategy.
Use Cases of Master Metrics
Digital Marketing Agency Client Reporting
Agencies can leverage Master Metrics to automate the entire client reporting lifecycle. By connecting all client ad accounts and social platforms, the platform aggregates data into unified dashboards and can generate AI-created Google Slides presentations for monthly reviews. This use case saves dozens of hours per client, improves report consistency and quality, and allows account managers to shift their focus from data compilation to strategic consultation and relationship management.
E-commerce Marketing Performance Monitoring
E-commerce teams use Master Metrics to gain a unified view of marketing performance across channels like Meta Ads, Google Ads, and TikTok, alongside sales data from platforms like Shopify. Custom alerts can monitor for sudden drops in conversion rate or ROAS, while budget control alerts ensure daily ad spend aligns with monthly targets. The Overview Table provides a daily snapshot of key metrics like customer acquisition cost (CAC) and lifetime value (LTV), enabling rapid, data-driven optimizations.
Multi-Account Portfolio Management for Franchises or Enterprises
Businesses managing multiple locations or brand accounts (e.g., franchise networks, multi-brand companies) utilize the Overview Control Panel to monitor the performance of all entities simultaneously. Executives can quickly compare performance across regions, identify top and bottom performers, and spot operational trends. Custom formulas allow for the calculation of region-specific KPIs, providing scalable oversight and ensuring local marketing efforts align with corporate goals.
Sales & Marketing Alignment via CRM Integration
By integrating CRM data with marketing performance metrics, sales and marketing leaders can use Master Metrics to track the full funnel. Teams can create dashboards that connect lead source cost from ads to opportunity value and close rate in the CRM. Alerts can be set for declining lead quality or changes in sales cycle length. This use case breaks down data silos, providing a shared source of truth that aligns both departments on metrics that truly impact revenue.
Frequently Asked Questions
What data sources does Master Metrics connect to?
Master Metrics is built to connect with a wide array of essential marketing and business platforms. This includes major ad networks like Google Ads and Meta Ads, social media platforms, analytics tools, and e-commerce systems. The platform also offers powerful connectors to Google Sheets and Looker Studio for further data manipulation and visualization. Specific source integrations are continually updated, and users should consult the official "Data Sources" page for the most current list of available connections.
How does the AI Google Slides presentation feature work?
The AI presentation feature is designed for efficiency. Users select the client or campaign, choose the specific data sources and metrics to include, and pick a visual design template. Master Metrics' AI engine then processes the selected data, identifies key trends and insights, and automatically populates a fully formatted Google Slides deck with charts, graphs, and summary narratives. The resulting presentation is editable, allowing for final customization before sharing with clients or stakeholders, streamlining a process that typically takes hours into minutes.
Can I control my advertising budget with Master Metrics?
Yes, proactive budget control is a core functionality. Master Metrics allows you to set a monthly budget for any campaign or account. The platform's alert system then calculates the required daily spend to meet that budget and monitors performance in real-time. You will receive notifications via your chosen channel (email, Slack, etc.) if the daily spend is significantly over or under the target percentage you define, enabling immediate adjustments to ensure optimal budget pacing and prevent overspending.
What is the difference between the Overview Table and a Dashboard?
The Overview Table is a centralized, customizable spreadsheet-like view within the Control Panel designed for at-a-glance monitoring and management of all accounts and key metrics. It's ideal for quick health checks and identifying outliers. Dashboards, conversely, are more comprehensive, visual data stories built for deeper analysis and reporting, often created in connected tools like Looker Studio using Master Metrics data. The Overview is for operational control, while dashboards are for analysis and presentation.
Pricing of Master Metrics
Master Metrics offers a tiered subscription model based on the number of accounts (data sources) you need to connect, with an option to try the platform free for 7 days. Plans scale from the Freelancer tier (15 accounts, starting at $30/month) to the Pro Plus 2 tier (250 accounts, at $439/month). Higher-tier plans include more accounts, access to more dashboards, and advanced features like the Looker and Sheets connectors, alerts, and the AI Slides functionality. All paid plans include free implementation support. The specific features, account limits, and monthly USD prices for each plan (Freelancer, Basic, Basic Plus, Intermediate, Intermediate Plus, Pro, Pro Plus 1, Pro Plus 2) are clearly detailed on the Master Metrics website, allowing businesses to choose the level that best matches their scale and needs.
Similar to Master Metrics
Adwize is an AI growth agent that connects ads, ecommerce, and CRM data to help teams create, analyze, and optimize campaigns.
EnsembleData provides real-time, scalable APIs for extracting posts, profiles, and analytics from major social media platforms.